
Constant updates are made to our site so check back often! You can use the Contact page to get in touch if you want to know something specific!
Sports prediction is a fascinating mix of number crunching, gut feeling and perhaps a dash of luck. But one secret weapon often overlooked is visualization. Transforming stats and odds into graphs and charts turns intimidating spreadsheets into clear pictures-now that’s an upgrade from chicken-scratch notes on napkins! Visualization makes the flood of sports data not just readable, but actually fun (well, at least as fun as math gets).
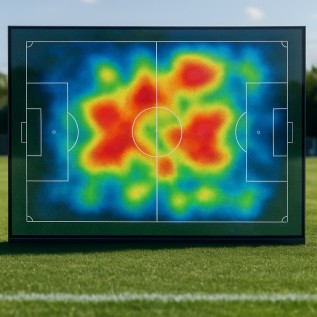
Spotting trends in sports data is a little like finding hidden treasures-except the X on the map is a cluster of dots or a brightly colored line. Using data visualization, patterns leap out from the noise. Suddenly, you notice the quarterback who always throws to the left or that underdog team that heats up in the second half.
Turning pages of statistics into visual diagrams is a bit like switching from a cryptic crossword to a connect-the-dots puzzle. Suddenly, what’s confusing becomes obvious-who knew points per game could look so lively? Visualization helps highlight trends before they become common knowledge, offering a fresh angle on age-old questions: who’s hot, who’s not and who might surprise next week.
But don’t get carried away-colorful graphics aren’t magic. A trend line can be a red herring, especially if the sample size is small or the matchups are irregular. That’s where the human element comes in: keep your eyes open and your skepticism sharper than your pencils.
Deciding who might come out on top doesn’t have to be guesswork. Visualization lets you literally see what the numbers are trying to tell you. Ever looked at a chart and suddenly realized you were about to miss a trend? Happens to the best of us. Making choices becomes less about intuition and more about visual cues.
More isn’t always better-sometimes, less is genius. Crowded dashboards with 14 shades of purple and 18 different chart types just add confusion. Stick to one or two key visuals for each question. If you’re hunting for performance streaks, a line chart suffices. Need to compare players? Try side-by-side bars. The goal is clarity, not chaos.
It’s not just about crunching numbers-your mind processes visuals faster than text or digits. There’s science behind it! When your brain sees a pattern, it wants to jump to conclusions (sometimes too quickly, so watch out). Visualization encourages careful analysis but also appeals to our love for shortcuts. Use that to your advantage: let visuals guide, not dictate.

Ever felt your heart flutter when a streaking red line shows your team’s last 10 victories? That’s your emotion stepping in. Visualization, if done well, keeps your feelings grounded in facts. Use these tools to balance excitement with reality, making decisions that are based on evidence, not wishful thinking.
If you find yourself falling in love with a chart, take a break! Step away, look at another visual and return with fresh eyes. You’re not marrying the data-just analyzing it.
Building a toolkit sounds fancy, but it’s really about choosing the right digital crayons. Some people swear by spreadsheets with built-in charts, while others get their kicks from interactive online dashboards. Start simple. Focus on the tools you’ll actually use-not the ones gathering dust in your downloads folder.
It’s easy to “pretty up” a chart by exaggerating the y-axis or cherry-picking stats, but let’s be honest-nobody likes a data manipulator. Keep your visualizations ethical and honest. A clear chart is worth more than a dazzling but deceptive one. If it’s too good to be true, it probably is-no matter how many neon colors you add.
When sharing visuals with others, always clarify what’s being shown. Transparency in data presentation goes a long way toward building trust (and helps everyone avoid embarrassing mistakes at Monday morning quarterback sessions).
Visualization can sharpen your approach, but let’s keep expectations reasonable-there’s no guaranteed outcome in sports prediction, no matter how sharp your charts look. Use visualization to enhance your enjoyment, bring new insights to light and stay mindful of the risks. Remember: the goal is entertainment, not a surefire path to fortune.
Just like in sports, it’s crucial to set boundaries. If you ever feel overwhelmed by the numbers or the urge to chase a loss, step back and take a breather. Visualization helps you spot trends, but you’re always in charge of your own decisions. Keep it fun, stay responsible and never bet more than you can afford to lose.
If you’re itching to bring visualization into your weekly routine, you’re not alone. Start by tracking a single sport or league, building out visuals as you go. Gradually, you’ll see what methods work best for you. No two sports fans are identical-your approach might look wildly different from your neighbor’s and that’s part of the fun.
Imagination isn’t just for painting sunsets or writing novels. When you visualize possible outcomes, you’re training your mind to spot opportunities (and pitfalls) before they hit. Don’t expect your visualizations to be perfect-think of them as sketches, not masterpieces. Over time, the more you practice, the more intuitive the process becomes.
Practical application is key. Start small, measure your results and tweak your visuals as you learn. Let the data surprise you and don’t be afraid to adjust your approach if you hit a losing streak or notice something unexpected. The goal is growth, not perfection.